If you want your manufacturing facility to run smoothly and profitably, you need to know your overall equipment effectiveness (OEE) score. This number reveals your plant’s true productivity by measuring how long your machines are running, how much product you are making, and how many of those products meet established quality standards.
Improving OEE can be difficult without the right data to guide you. With the right data, it’s simple. Learn how the OEE measurement is calculated, why that’s important, and what you can do to achieve a higher score.
How to Calculate Overall Equipment Effectiveness
A factory’s OEE score is made up of three component KPIs: availability, performance, and quality. Each component compares two figures and is expressed as a percentage.
1. Availability
Your availability score measures how long your machines operated within a planned production period, excluding planned shutdowns for things like maintenance or holidays. If your production run was scheduled to last 4 hours but was interrupted by a thirty-minute equipment breakdown, your Availability score would be 87.5%.
2. Performance
The performance score measures how many units your machines were able to produce in a given timeframe compared to their maximum output during that same amount of time. If your production run should produce 25,000 units and you only made 22,000 units, your performance score would be 88%.
3. Quality
A quality score measures how many finished units were produced compared to the number of units that were begun during a production run. If your production run started with 10,000 units and just 9,000 of those units were finished to an acceptable standard, your Quality score would be 90%.
To find your facility’s OEE score, simply multiply the three percentages. For instance, if your availability score is 75%, your performance score is 80%, and your quality score is 85%, your OEE score would be 51%.
As you can see, the nature of this calculation makes it extremely difficult to achieve a high OEE score. The more points you lose on any one of the three component KPIs, the more any losses on the other 2 components bring down your OEE.
What Is Considered a Typical OEE?
Without context, it’s easy to assume you should be aiming for a 100% OEE score. After all, that would reflect a perfectly run facility, wouldn’t it?
It would, but that’s exactly why it makes a terrible goal. Perfection is never achievable in real-world conditions. No matter how carefully you plan for contingencies, unforeseen events will always appear.
The gold standard for OEE KPIs is as follows:
90% availability (collected digitally) x 95% performance (production rate) x 99% quality = 85% OEE
Only the very best facilities manage to achieve this score, and it takes a lot of hard work and resources to make it happen. A typical OEE score is much lower than that – often less than half.
Aiming for a score you’ll probably never achieve only obscures the real victories that come with more modest OEE improvements. Every additional percentage point you can muster represents extra revenue for your facility; in many cases, tens of thousands of dollars.
A better way to frame your OEE production expectations is to calculate your initial OEE score and simply do your best to beat it. Gradually raising the bar ensures you are always aiming high, but also that your goals remain realistic and within your reach.
How to Improve OEE in Production
The easiest way to improve your facility’s OEE value is to target the component KPI that is furthest from the gold standard. This should allow you to make swift yet substantial changes that demonstrate how effective OEE improvements can be part of your plant’s overall success strategy.
Availability is the most straightforward of the three OEE KPIs and therefore the easiest to improve. Collecting real-time data about why unplanned work stoppages occur allows you to understand the root causes of equipment failure. Once you know this, you can implement strategies such as preventive maintenance to reduce the number and duration of equipment breakdowns in your facility. Digital software can also be used to establish a direct link between machine operators and technicians to address maintenance needs as quickly as possible. With these changes, you can build your factory floor plan to optimize your resources, monitor production progress in real-time, and adjust production based on actual resources.
The reasons for low performance are more difficult to pinpoint. Identifying what is causing the issue usually requires an in-depth dive into your facility’s production data. The advanced analytics that are offered by leading shop floor control software make this easy to do.
Where does production tend to stall and why? If you think you’ve found the problem, try experimenting with the processes around it. Sometimes rearranging the order in which certain things are done or reassigning a few staff members can make a big difference to overall production performance.
To improve your quality score, focus on the QC processes within your facility. What kinds of defects are you finding most often? How can you reduce the rate at which they appear? Is there a problem with some of your equipment, or could your staff perhaps use refresher training regarding quality standards? Shop floor software can shed light on this issue by automatically devising a plan to streamline your facility’s quality control processes and eliminate these issues.
Once you’ve addressed your weakest KPI, you can move on to the next weakest of the three. With enough time and attention, you may be able to bring all 3 components up to world-class standards.

Changing the way people work in factories
Request a DemoMake Matics Part of Your OEE Improvement Plan
Improving your real-time OEE is imperative to your manufacturing plant’s long-term success. To do this, you will need access to extremely detailed, accurate, and up-to-the-minute production data.
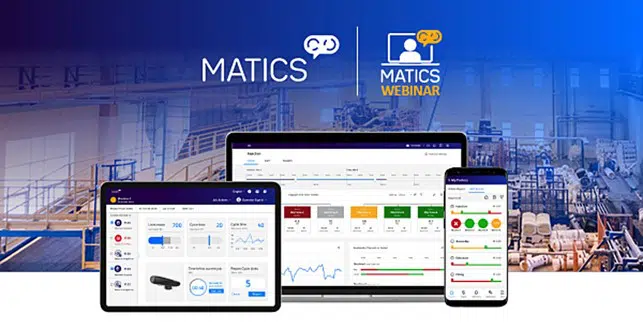
You can trust Matics to deliver the real-time manufacturing analytics you need to make substantial improvements to this critical manufacturing metric. Our software delivers a constant stream of production data to a cloud-based platform that synthesizes it into useful charts, graphs, and other displays. You and your workers can access this platform at any time to review current and historical data, observe trends over time, and track the impact of changes on your overall productivity.
A higher OEE score could be just a few adjustments away.
Contact us today to learn more about our product and how you can use it to drive meaningful changes to your facility’s OEE.