OEE Value: How to Calculate the Financial Impact of OEE?

OEE is a well-known manufacturing KPI that measures the total efficiency of a production plant, but it can also be reframed as a potent financial indicator.
When displayed in monetary terms, the OEE manufacturing metric can be used to illustrate the potential economic impact of production optimization and justify investments that will increase efficiency in your facility.
What Is OEE?
OEE is measured by combining three different production metrics:
- Availability, or how efficiently the plant’s machines are being used. An availability score of 100% indicates that none of the machines stopped at all during allotted production hours.
- Performance, or how quickly production occurs. A performance score of 100% indicates that a facility’s machines are running at maximum cycle time efficiency and speed at all times while they are in operation.
- Quality, or how well the facility is meeting established product standards. A quality score of 100% indicates that every product the facility makes meets or exceeds quality control standards and can safely be shipped to distributors.
The OEE KPI has clear value in a production context, but quantifying that value can be difficult. The concept of production efficiency is abstract compared to the tangible reality of the facility’s bottom line.
You know that a 70% OEE score is better than a 60% score, but what does that mean in terms of a plant’s profitability?
Translating OEE measurements into dollar value amounts helps to clarify what is truly at stake when decisions are made regarding factory efficiency. A gain of even 1% can represent hundreds of thousands of dollars in profits. Turning the OEE model into a financial figure makes a clearer case for even small increases in factory optimization and helps spur motivation to make positive changes, especially among money-conscious executives.
Calculating OEE’s Financial Relevance
There are several ways to estimate your facility’s OEE value in financial terms, depending on the information you have available.
Suppose that you know that your facility could theoretically produce 50,000,000 units per year and your facility currently has an OEE score of 65%. In this scenario, actual yearly production will measure approximately 32,500,000 units.
Based on the DuPont analysis (used to evaluate the component parts of a company’s return on equity), if you sell those units for $0.75 each, you will receive $24,375,000 in yearly total revenue.
Assuming your variable cost per unit is $0.50, and your total fixed costs are $2,000,000, you will receive a total profit of $6,125,000 = $24,375,000 – ($0.50 * 32,500,000) – $2,000,000.
Divide this by your plant’s current OEE score (remember, it is 65% in this case), and you discover that each point of your OEE score is worth approximately $94,230 yearly.
If you already know exactly how much yearly profit you are making, you can skip some steps and instead divide your total monthly or yearly profit by the number of percentage points in your OEE score. For instance, if your facility generates $10 million of profit each year and boasts an OEE score of 70%, you would divide $10 million by 70 for a final result of approximately $142,857. Each percentage point increase in OEE is therefore worth nearly $150,000 in profits in this case.
Managing OEE KPIs on the Factory Floor
The impact that OEE can have on any manufacturer’s bottom line is clear, but how exactly can they go about addressing their OEE? Before implementing any specific actions to work before an improved OEE, manufacturers need to understand how to manage the KPIs that makeup OEE on the factory floor.
Manufacturers need an effective way to evaluate availability, performance, and quality. The overall values used to determine OEE will come from individual values throughout the organization, the availability, performance, and quality being achieved by individual machines and across individual shifts.
Tracking these trends granularly and accurately is vital, and manufacturers need an effective solution to handle the data aggregation and analysis involved. Most importantly, they need a real-time solution that lets them know how OEE stands at any given moment, not just in month-end reports.
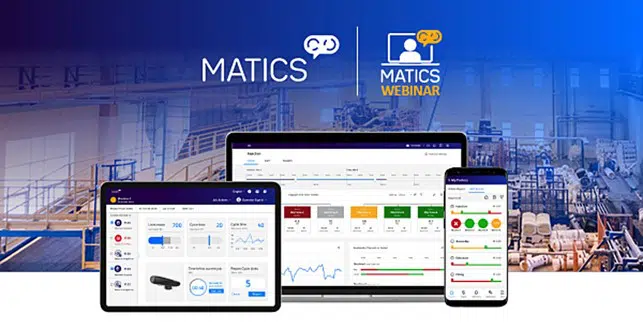
Matics Real-time Operational Intelligence (RtOI) provides the real-time KPI tracking capabilities necessary to understand what’s really happening on the factory floor. Manufacturers can define custom KPIs and compare trends across individual machines, shifts, and even multiple facilities to gain the best possible insight into OEE. Most importantly, these real-time capabilities let manufacturers know how KPIs are faring at that moment instead of after the fact.
With the necessary KPI management and monitoring capabilities, manufacturers can start to take practical action on the factory floor to realize the value of their OEE.
Improving Your OEE Value
Once you know how valuable OEE increases can be, the next step is to optimize your operations and make those hypothetical gains a reality.
Take our previous example: if you succeed to increase your OEE from 65% to 70%, you will increase your profit from $6,125,000 to $16,750,000.
Bear in mind that a high OEE is not easy to reach. An OEE of 85% is considered world-class; most facilities will struggle to reach this benchmark, and vanishingly few will ever surpass it. Setting a realistic OEE KPI goal based on that knowledge is critical to achieving success. Perfection is not achievable, but improvement is highly likely with the right set of tools.
Real-time manufacturing analytics software is one of the most important among these tools. This technology displays manufacturers’ real-time OEE alongside other production data to guide decision-making and improve reactivity to spontaneous events on the factory floor. The information it provides can help you:
- Reduce machine downtime with strategies like preventive maintenance routines.
- Ensure production cycles remain within standard time parameters.
- Track reject products and scrap to identify and resolve early-stage quality control problems.
These changes can significantly boost your OEE score and can be implemented in surprisingly little time – many facilities experience a measurable difference in productivity in as little as a few weeks.

Changing the way people work in factories
Request a DemoImprove OEE With Real-Time Manufacturing Analytics of your Production Journey
A higher OEE score is your facility’s ticket to higher profits. Matics can help you get there.
Our mobile remote factory monitoring technology connects all of your facility’s equipment to a single cloud-based software solution. Both workers and management can use it to access factory efficiency data from anywhere at any time. It integrates easily into any existing machinery and can be installed by a single person with little technical knowledge in a matter of a day.
Matics RtOI provides the KPI management and monitoring capabilities needed to take control of OEE, along with an extensive range of additional features. Your facility can achieve a true digital transformation with real-time data aggregation and analysis and the automated work management tools needed to put those insights to use in the most effective way possible.
Interested? Contact us today to consult with one of our staff members or request a demo to see for yourself what our product can do.


